Missing value imputation is an important topic in data science. It is a basic method for solving incomplete dataset problems where one or more than one data point is missing. Three types of missingness mechanisms can cause an incomplete dataset. They are missing completely at random (MCAR), missing at random (MAR), and not missing at random (NMAR).
Generally, suppose 10–15% of data points are missing from a dataset. Those data points can be removed from the analysis (although this percentage depends on specific domains) without significantly affecting the results. When it exceeds 15%, one needs to be cautious before removing the data points as it might dramatically affect the conclusion. Interested readers are encouraged to read this review article on missing value imputation.
Imputation is the process of replacing missing data with 1 or more specific values, to allow statistical analysis that includes all participants, not just those with no missing data.
Missing value imputation is a process in which some statistical or machine learning techniques are implemented to replace these missing data points with substituted values. Statistical methods, such as mean/mode and regression, have been widely used for imputation. Besides, machine learning techniques, such as the k nearest neighbour, artificial neural network, and support vector machine techniques have been employed in several analyses in recent years. There are specific techniques for different domains. For example, here is a review article on missing value imputation techniques in bioinformatics(https://link.springer.com/article/10.1007/s10462-019-09709-4).
Some popular or widely used methods are: linear regression (LR), least squares (LS), and mean/mode. The mean and mode methods are the simplest imputation methods for imputing numerical and categorical attribute values. Among, ML techniques the most widely method is kNN imputation.
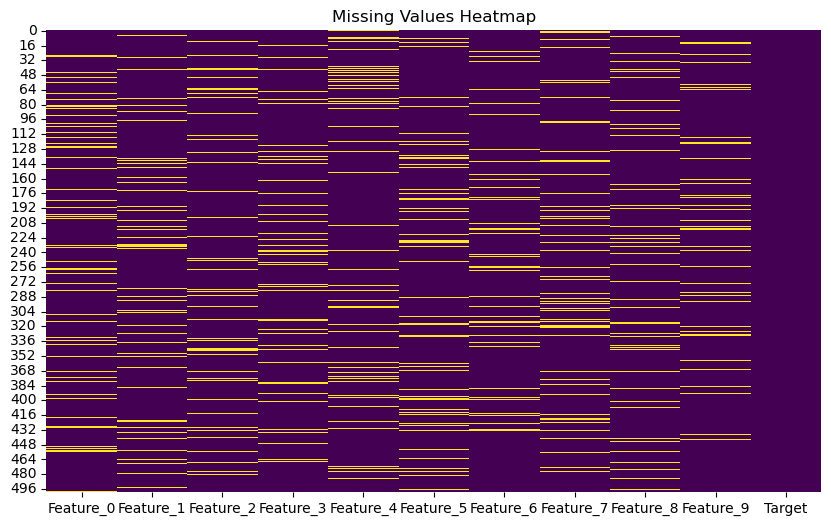
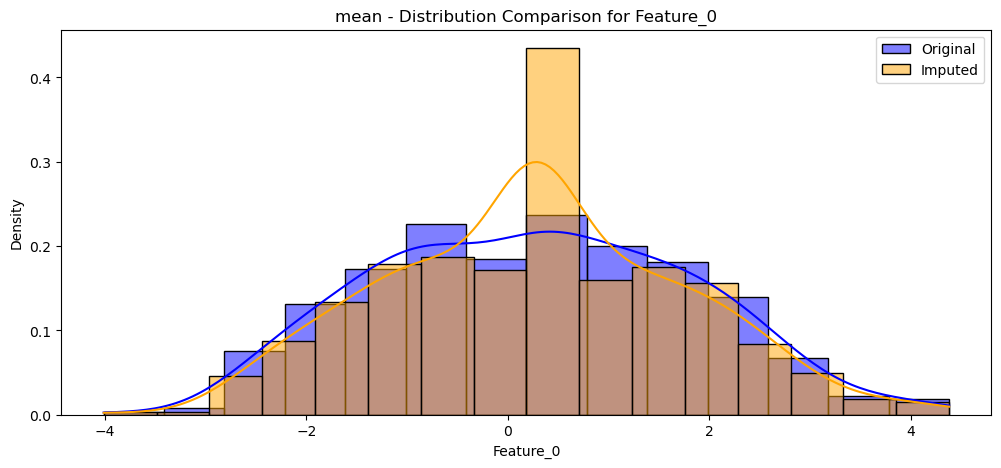
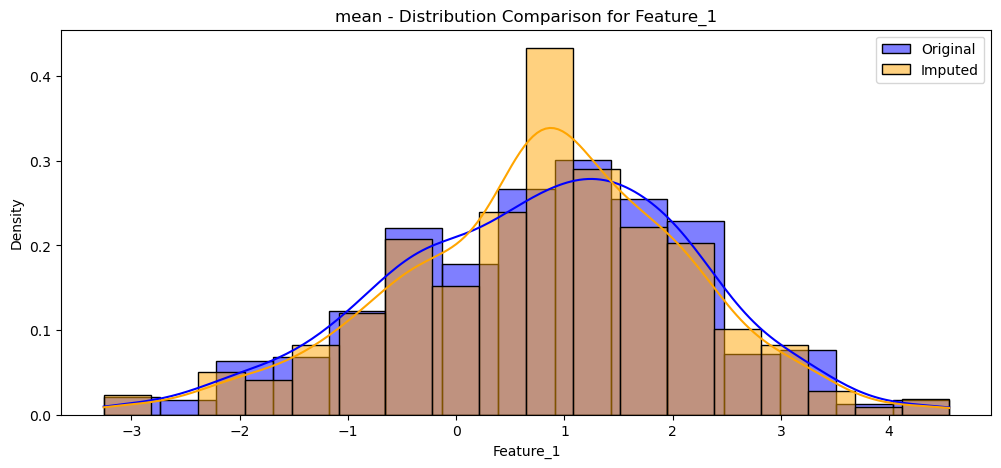
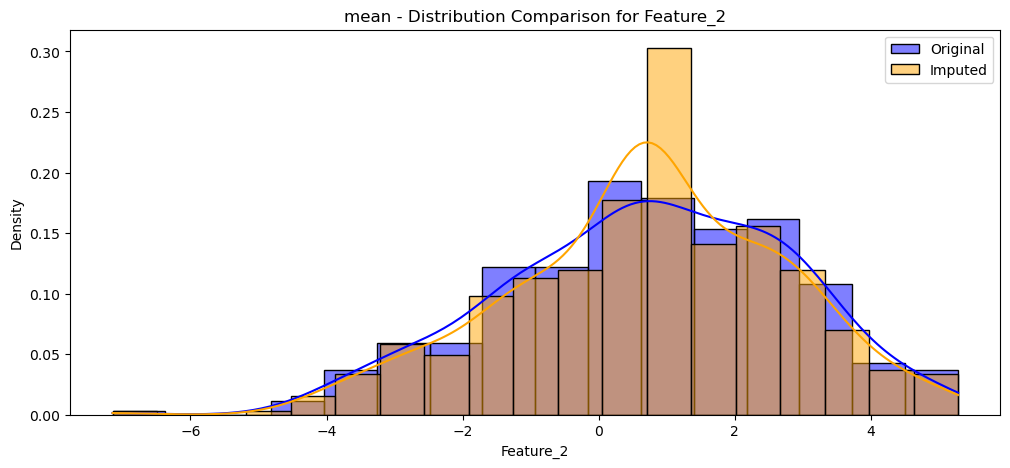
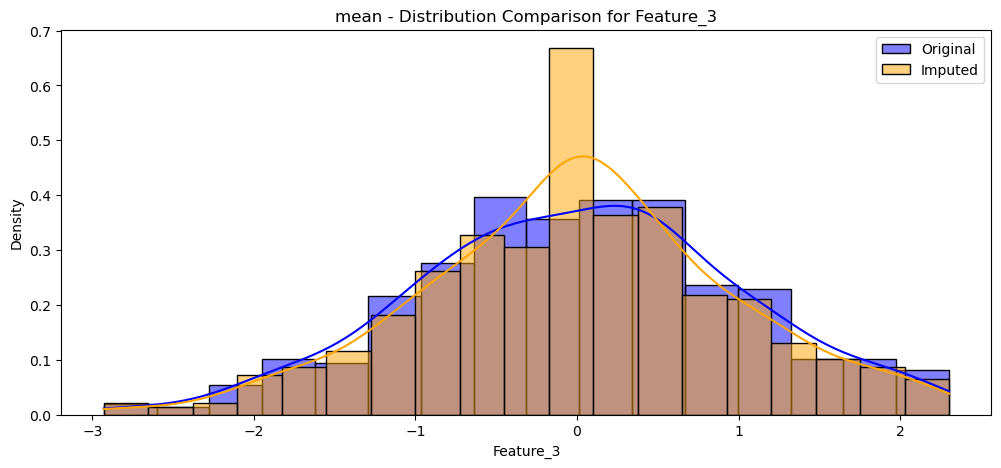
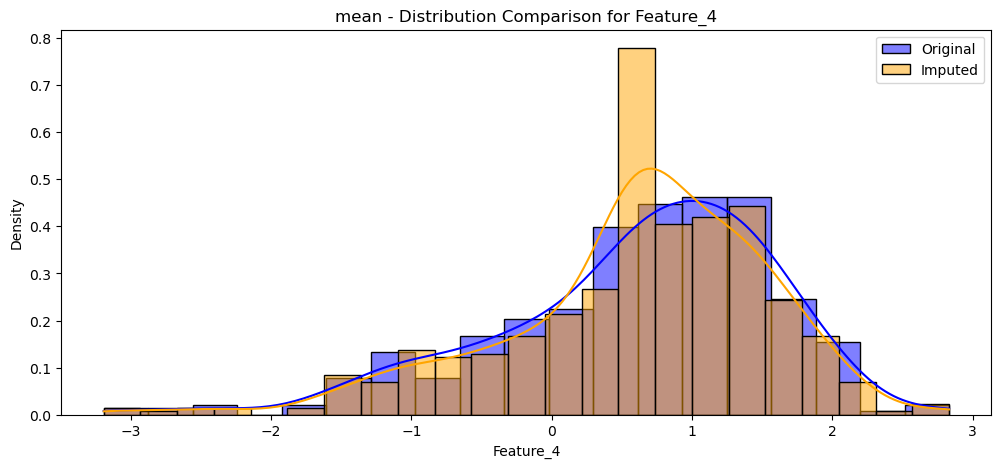
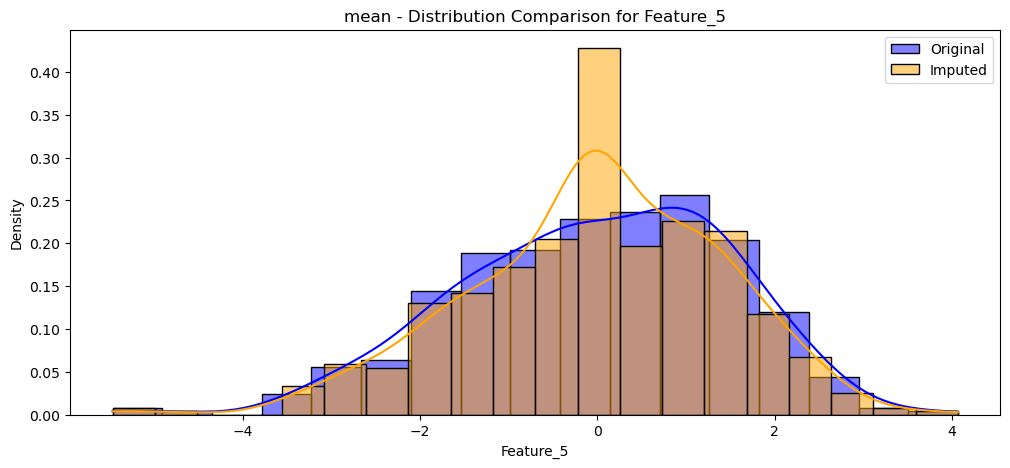
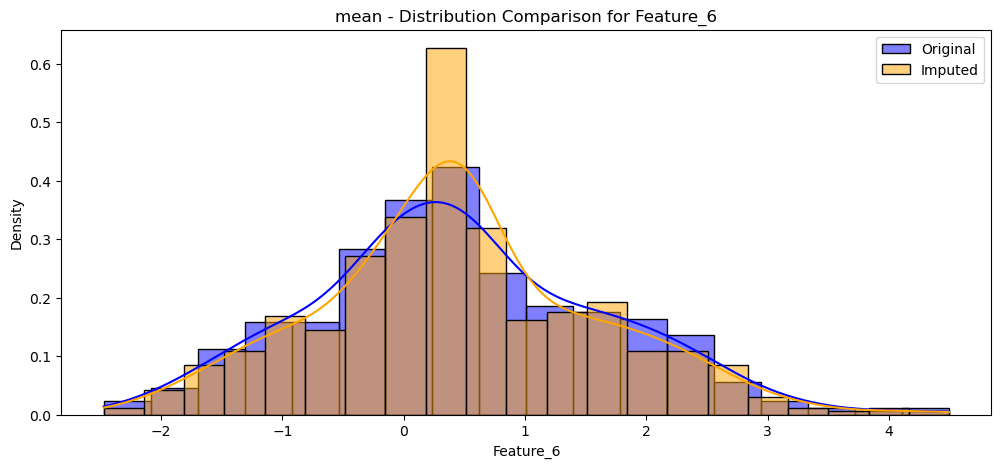
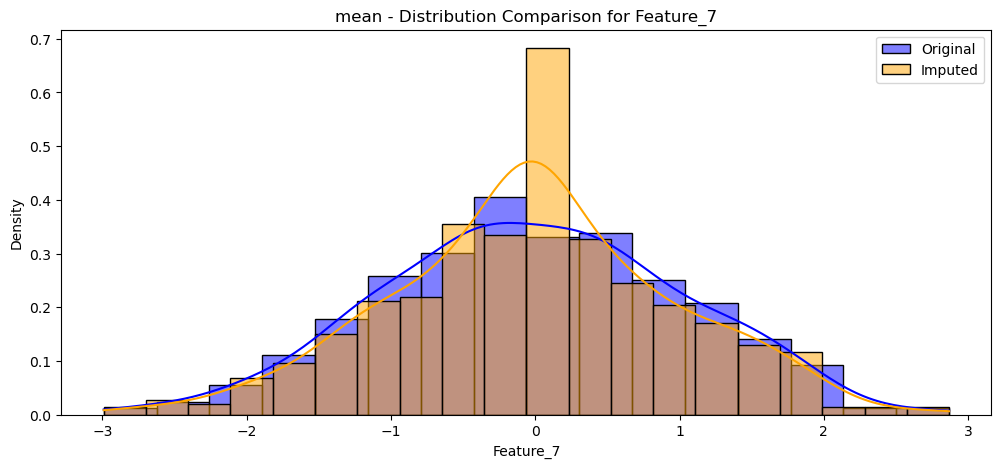
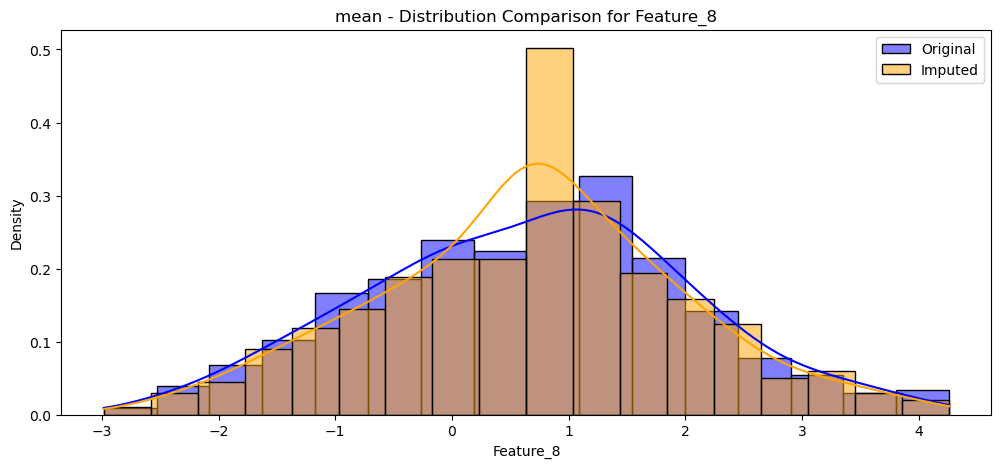
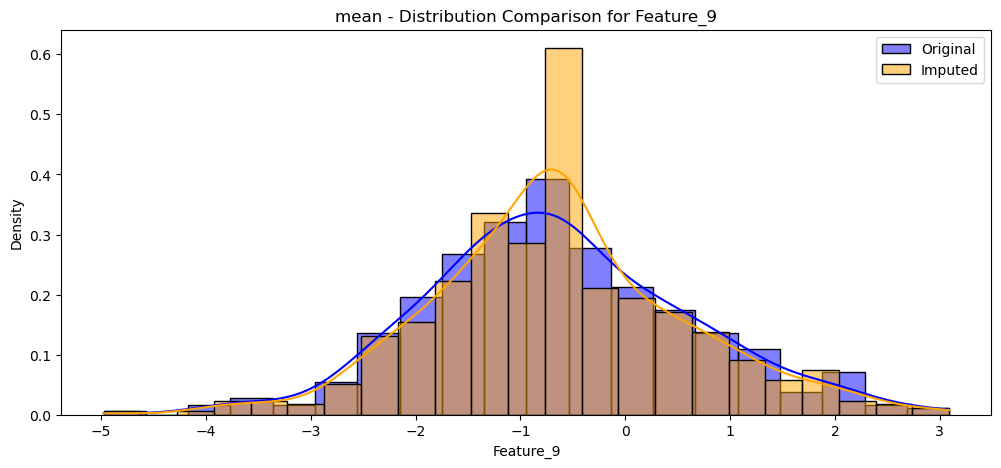
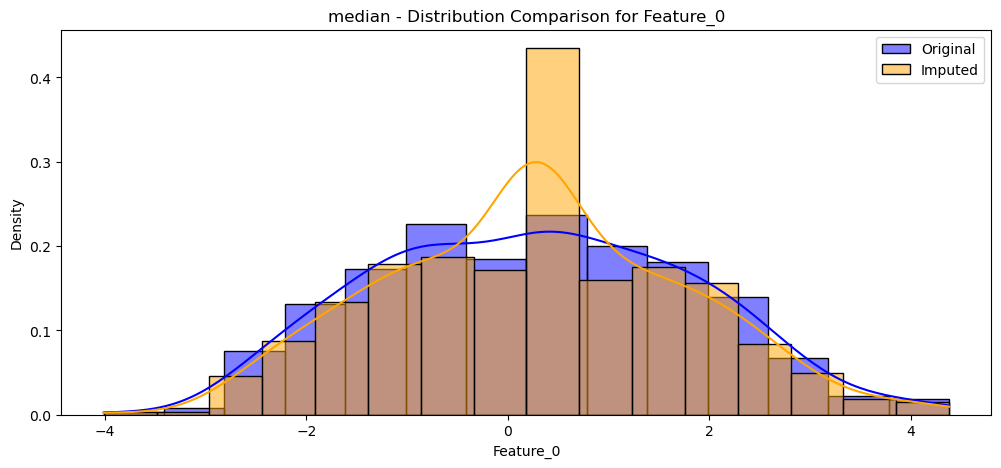
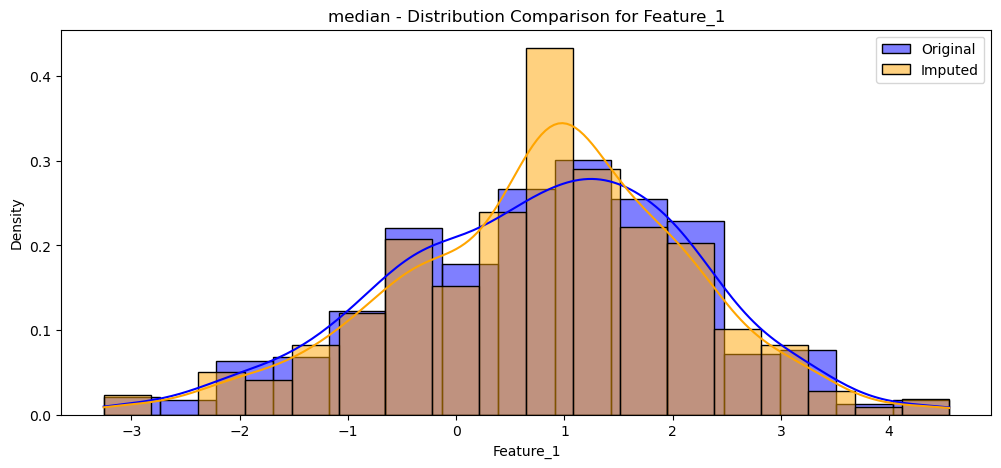
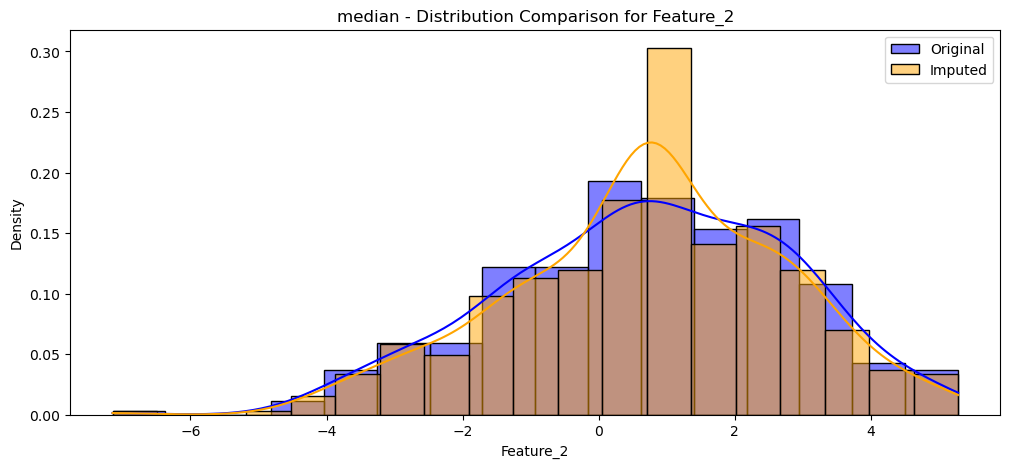
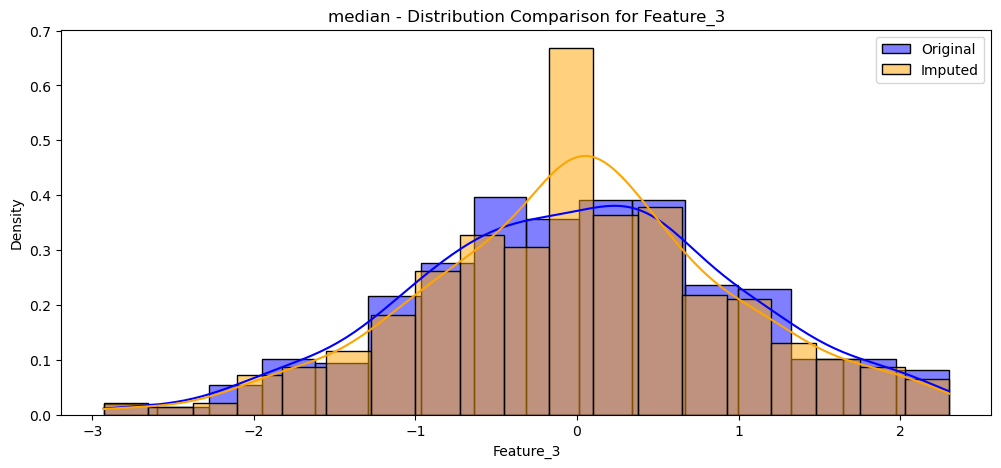
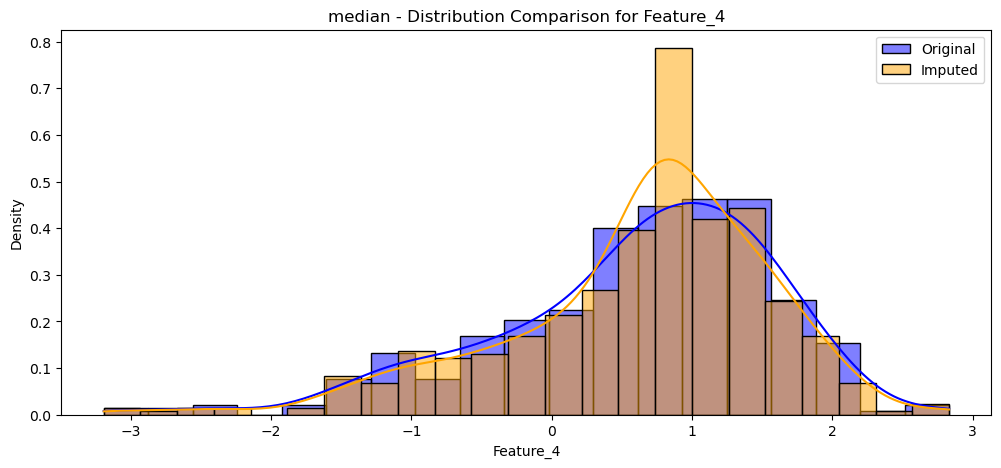
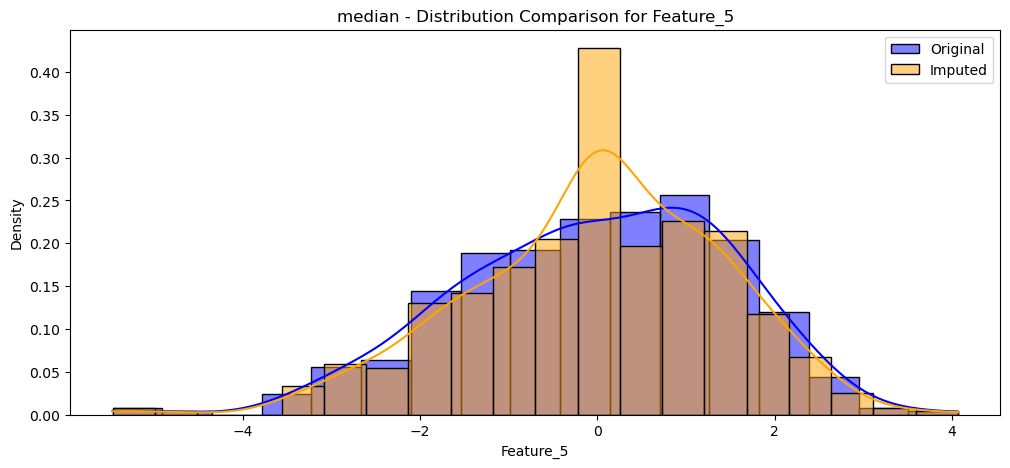
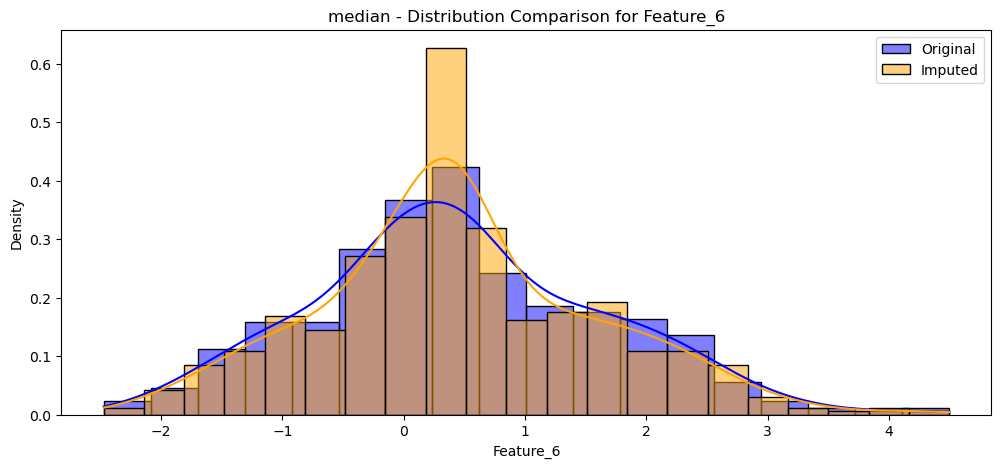
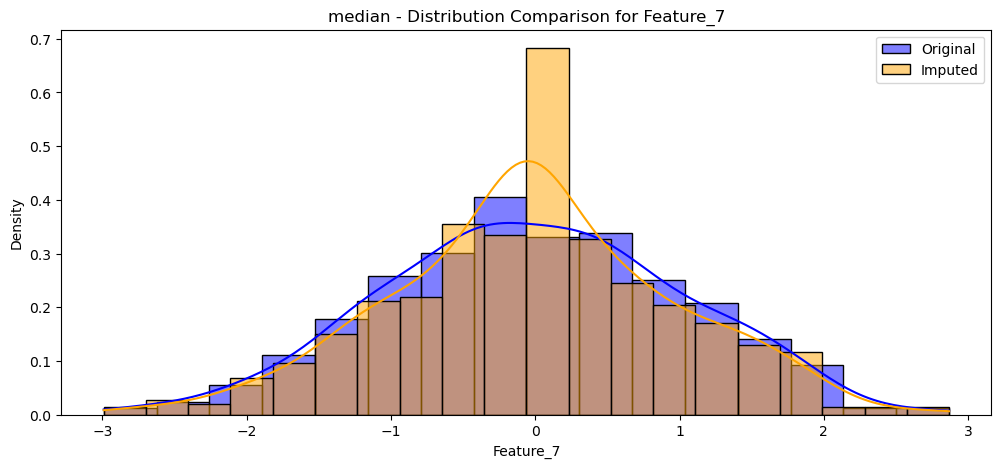
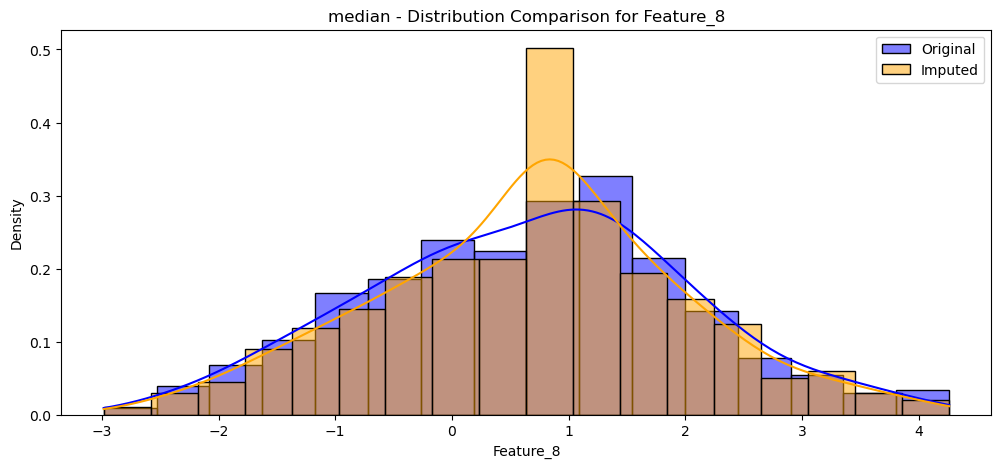
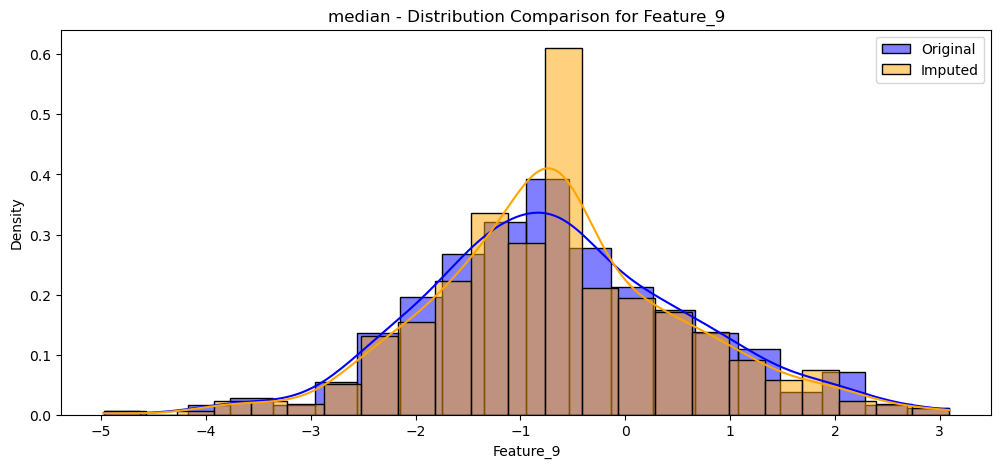
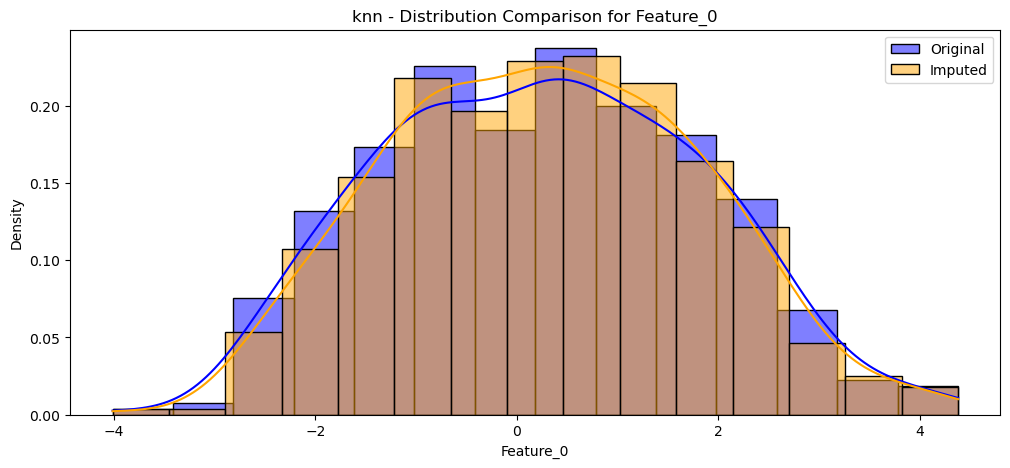
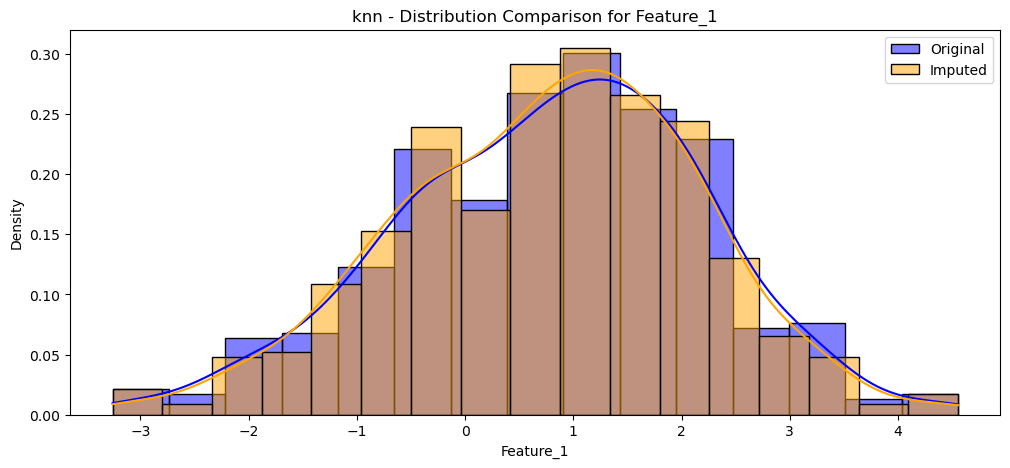
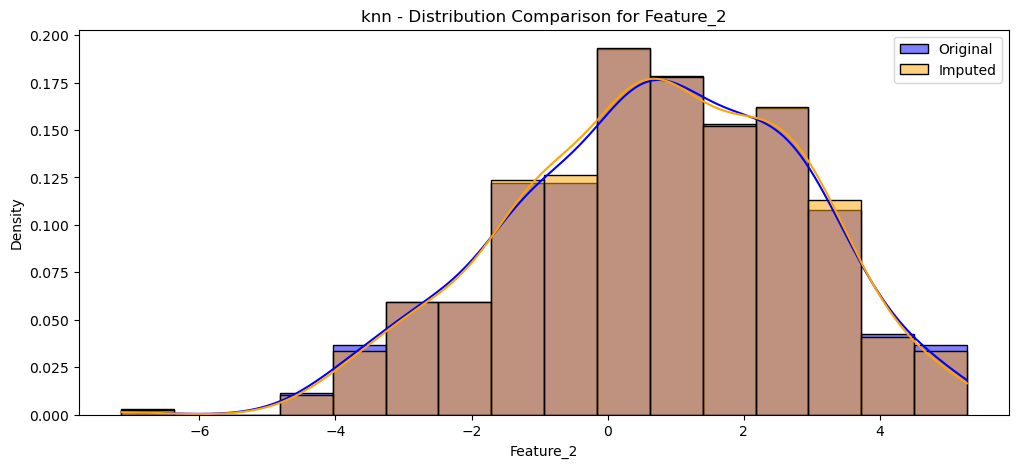
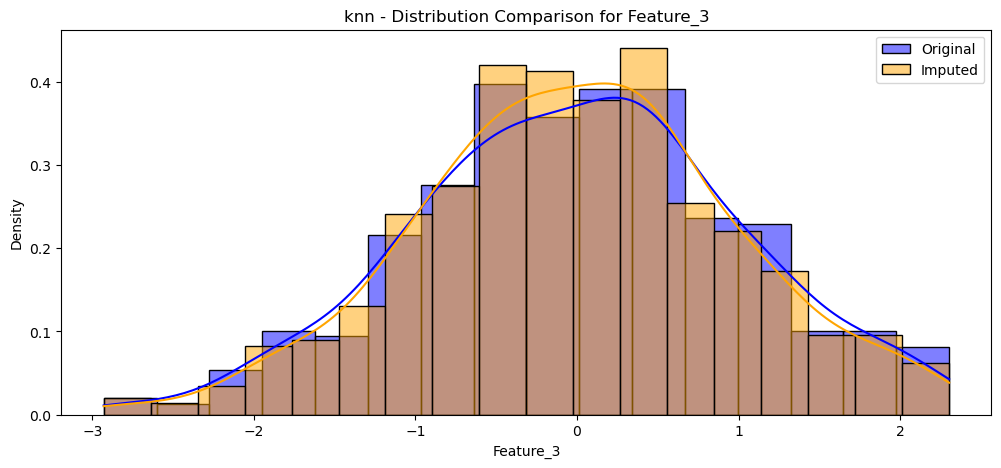
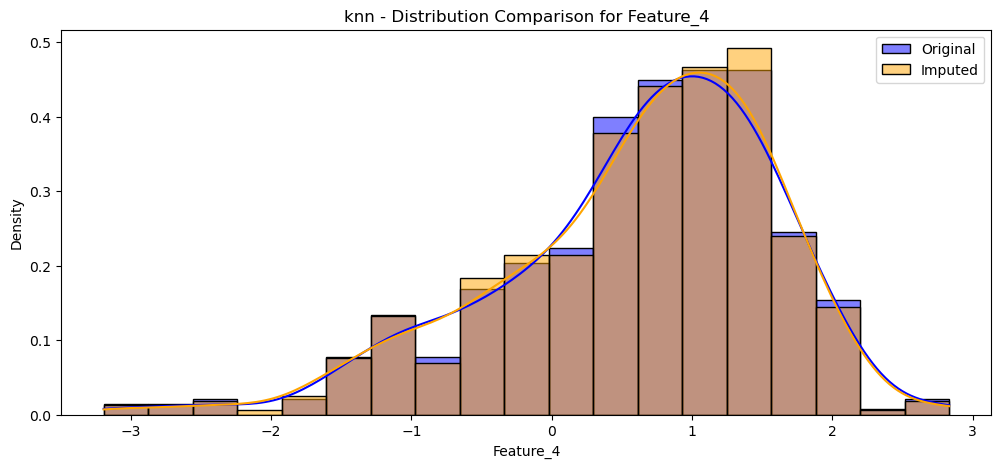
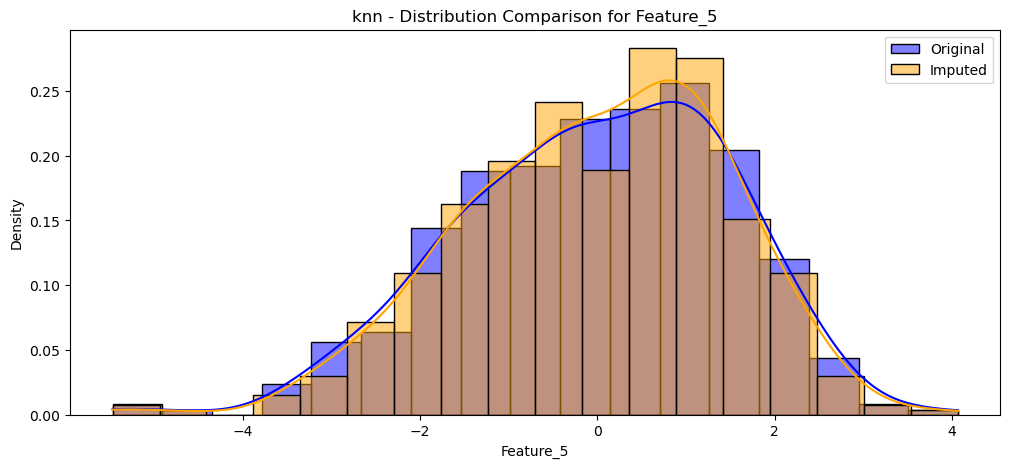
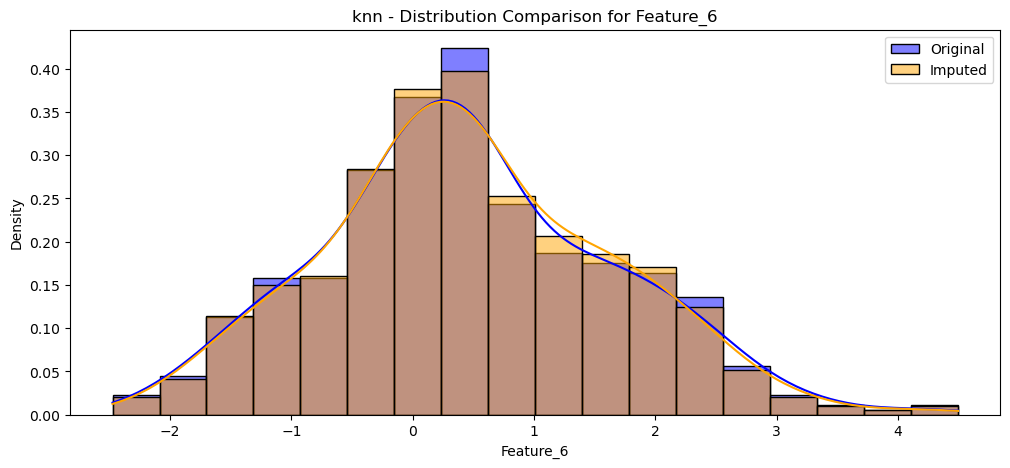
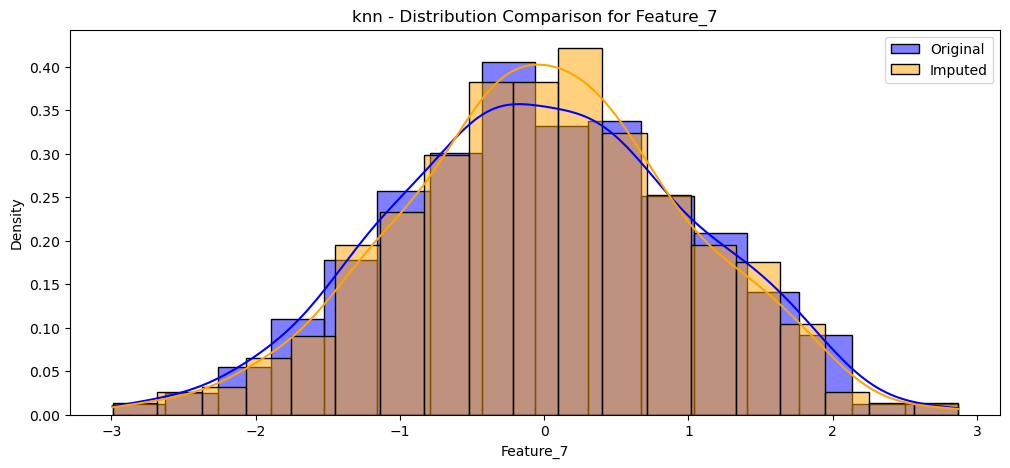
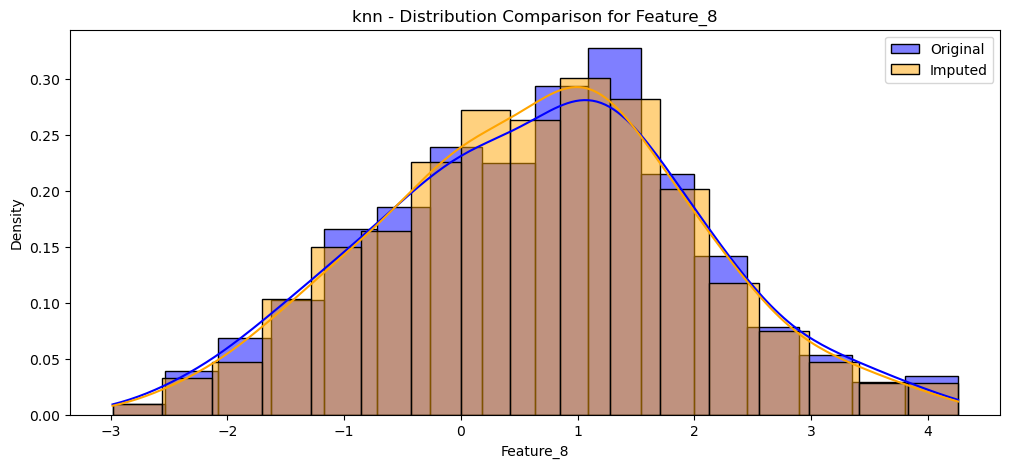
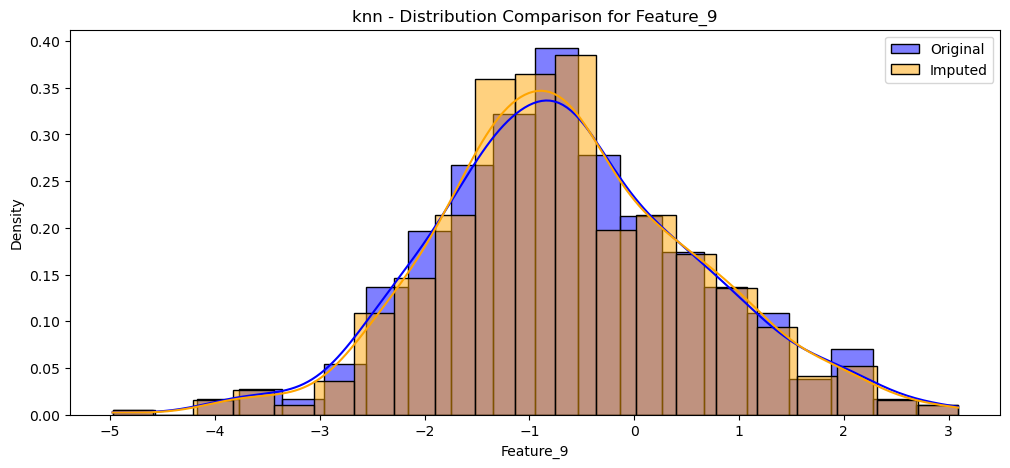
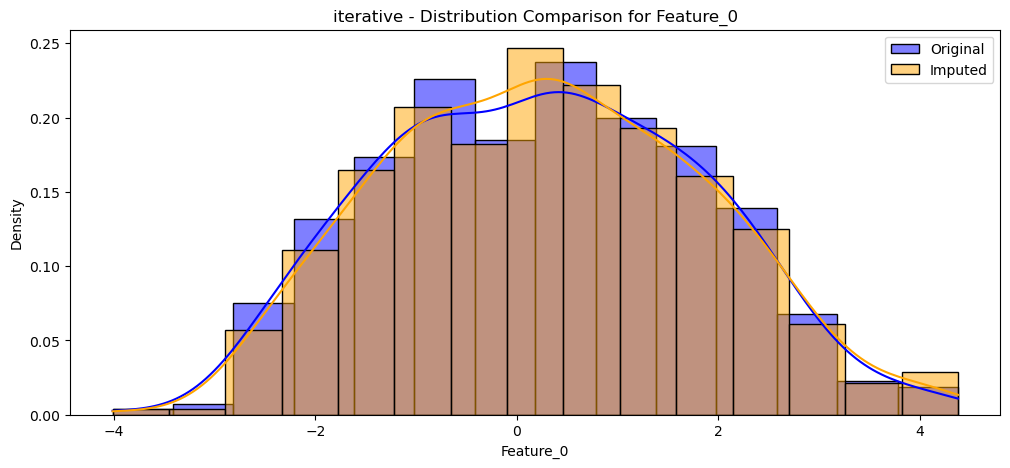
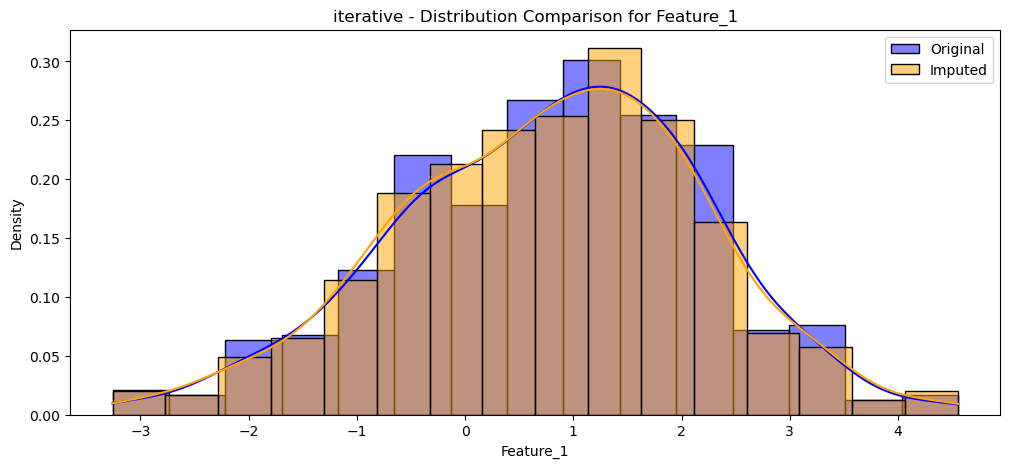
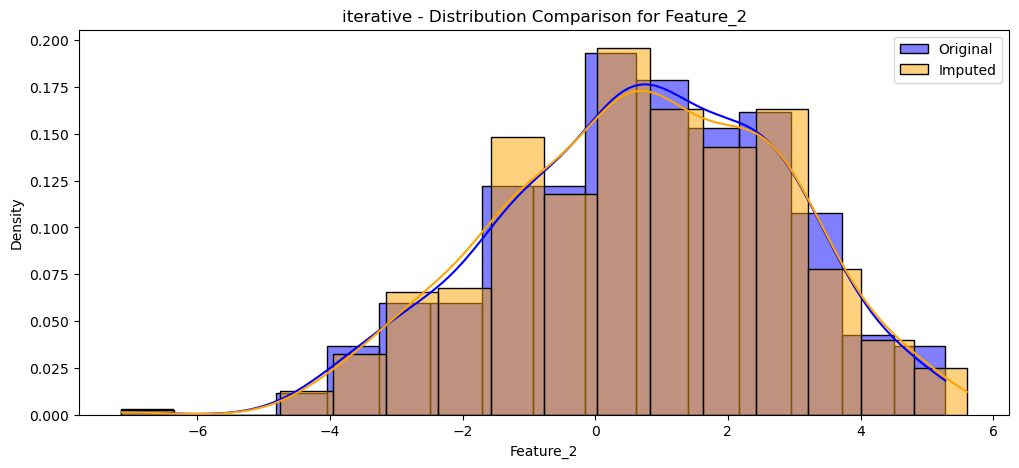
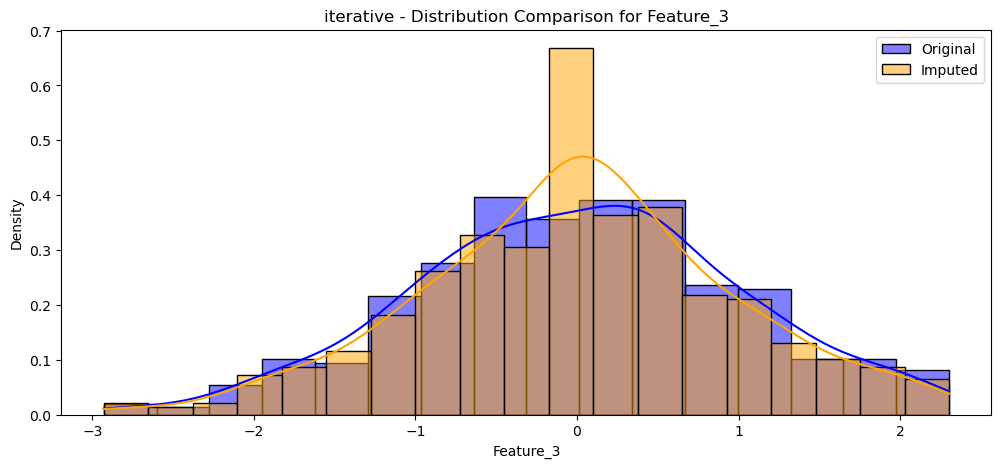
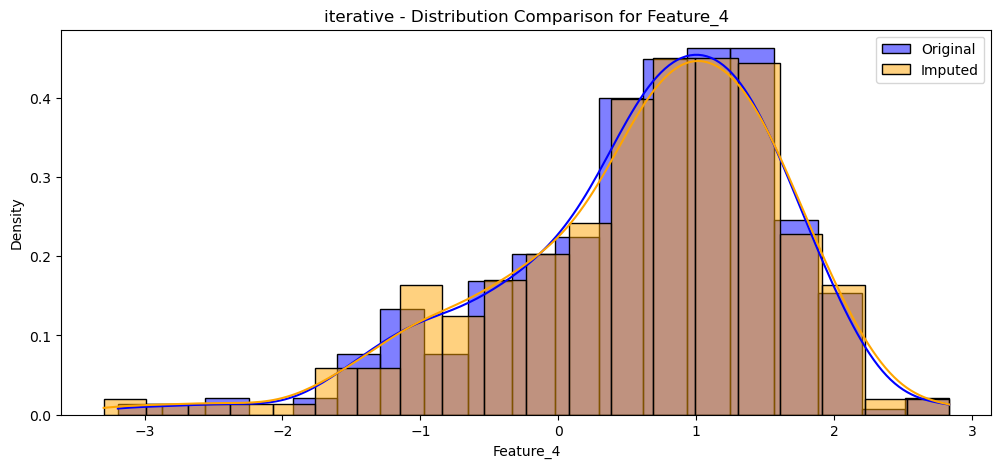
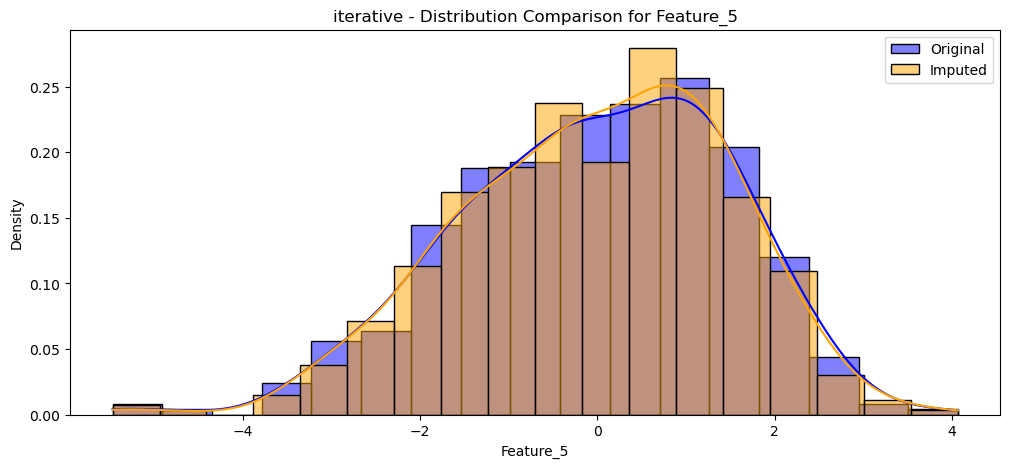
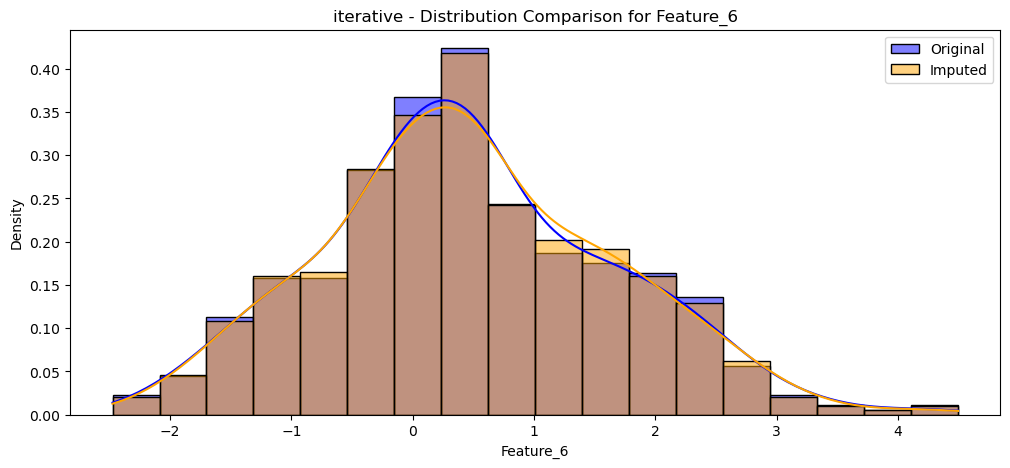
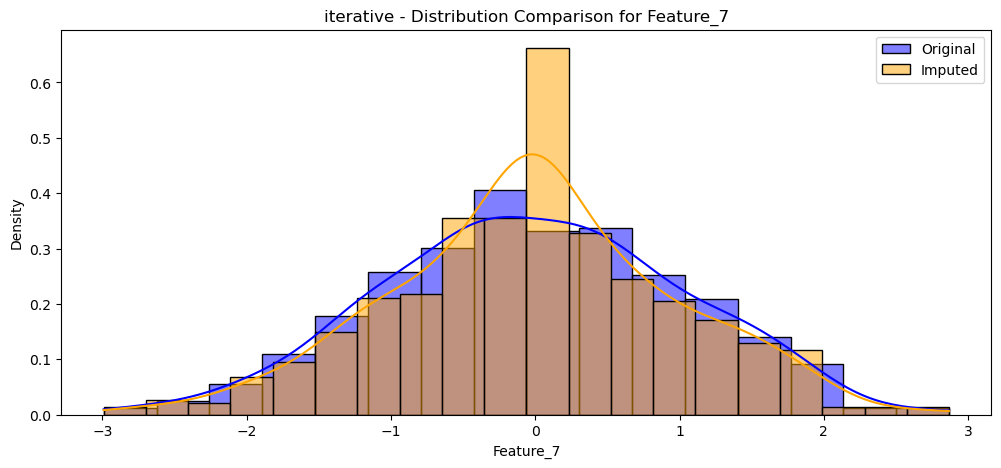
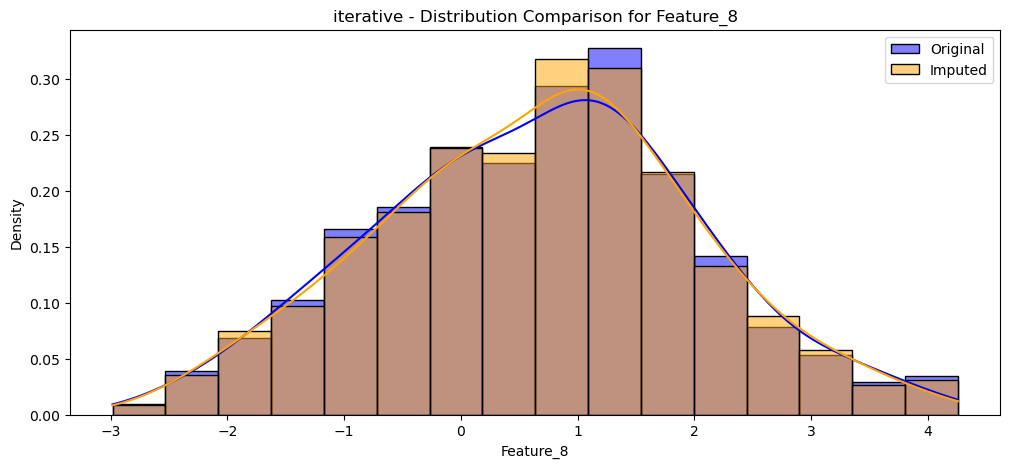
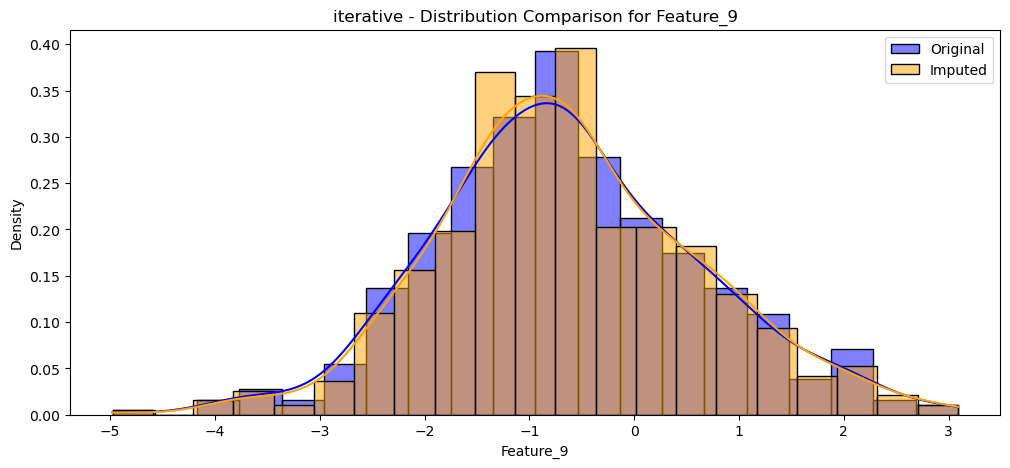
# Import required librariesimport numpy as npimport pandas as pdimport matplotlib.pyplot as pltimport seaborn as snsfrom sklearn.datasets import make_classificationfrom sklearn.impute import SimpleImputer, KNNImputerfrom sklearn.experimental import enable_iterative_imputerfrom sklearn.impute import IterativeImputer# Generate synthetic data with missing valuesdef create_data(): X, y = make_classification( n_samples=500, n_features=10, n_informative=5, n_redundant=3, n_classes=2, weights=[0.7, 0.3], random_state=42 )# Introduce missing values randomly rng = np.random.default_rng(42) missing_mask = rng.random(X.shape) <0.1 X[missing_mask] = np.nan data = pd.DataFrame(X, columns=[f"Feature_{i}"for i inrange(X.shape[1])]) data['Target'] = yreturn data# Visualize missing valuesdef visualize_missing(data): plt.figure(figsize=(10, 6)) sns.heatmap(data.isnull(), cbar=False, cmap="viridis") plt.title("Missing Values Heatmap") plt.show()# Generic imputation functiondef impute_data(data, method='mean'): X = data.drop(columns=['Target']) y = data['Target']if method =='mean': imputer = SimpleImputer(strategy='mean')elif method =='median': imputer = SimpleImputer(strategy='median')elif method =='knn': imputer = KNNImputer(n_neighbors=5)elif method =='iterative': imputer = IterativeImputer(random_state=42)else:raiseValueError("Unsupported imputation method") X_imputed = imputer.fit_transform(X)return pd.DataFrame(X_imputed, columns=X.columns), y# Visualize original and imputed datadef visualize_distributions(original, imputed, method_name):for col in original.columns: plt.figure(figsize=(12, 5)) sns.histplot(original[col].dropna(), kde=True, label="Original", color='blue', stat='density') sns.histplot(imputed[col], kde=True, label="Imputed", color='orange', stat='density') plt.title(f"{method_name} - Distribution Comparison for {col}") plt.legend() plt.savefig(f"{method_name}_{col}_distribution_comparison.png") plt.show()# Main function to execute full imputation projectdef main(): methods = ['mean', 'median', 'knn', 'iterative'] data = create_data()print("Original Data with Missing Values:")print(data.head()) visualize_missing(data)for method in methods:print(f"\n--- Using {method} imputation method ---") imputed_data, target = impute_data(data, method=method) visualize_distributions(data.drop(columns=['Target']), imputed_data, method)if__name__=="__main__": main()
The choice of method should be informed by the pattern of missingness, data type, and downstream modeling goals.
0.1 References
Resources for Further Reading: - Little, R. J. A., & Rubin, D. B. (2019). Statistical Analysis with Missing Data. https://onlinelibrary.wiley.com/doi/book/10.1002/9781119482260#aboutBook-pane
van Buuren, S. (2018). Flexible Imputation of Missing Data. https://stefvanbuuren.name/fimd/
Yulei He et al. (2021). Multiple Imputation of Missing Data in Practice. https://www.routledge.com/Multiple-Imputation-of-Missing-Data-in-Practice-Basic-Theory-and-Analysis-Strategies/He-Zhang-Hsu/p/book/9781032136899?srsltid=AfmBOorj6QGt4FuhRCHrlex0LRB7ob6DeWEi8LfhP97-NodAlRToRsYn